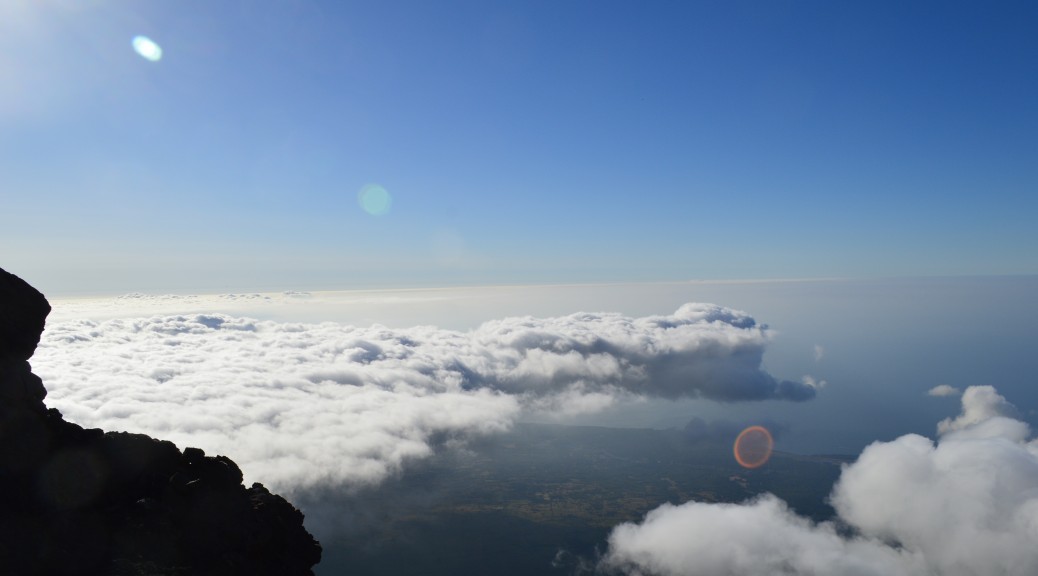
Here, we present preliminary observations of the free tropospheric aerosols (particles) intercepted at the Observatory in 2015, 2016 and 2017. These particles were likely transported for long distances over the Atlantic from surrounding continents.
Right click on the graphs and open image in a new tab to see the enlarged versions.
Aerosol Concentrations
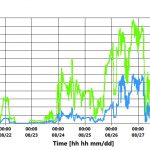
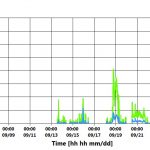
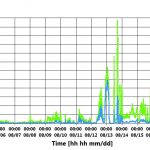
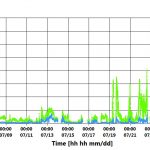
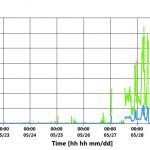
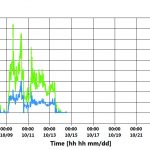
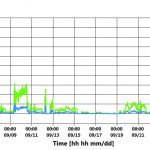
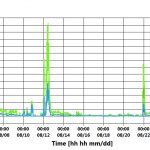
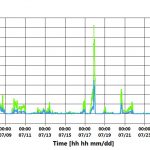
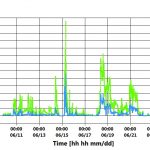
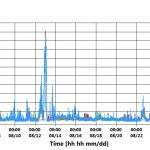
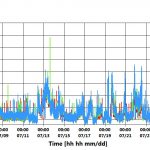
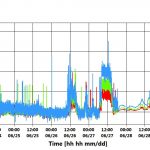
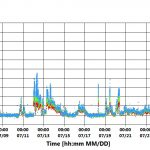
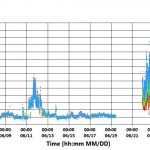
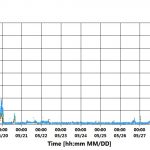
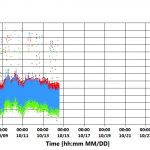
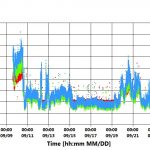
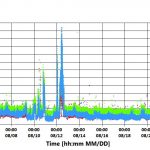
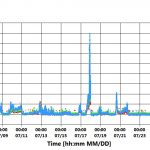
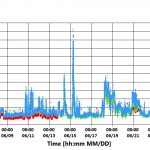
The following graphs depict the atmospheric aerosol number concentration (particles of size above 0.3 micrometers in green and 0.4 micrometers in blue) time series.
2018
2017
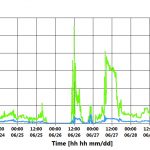
2016
The particle counter stopped running on August 3rd, but the scattering data (below) are still acquired.
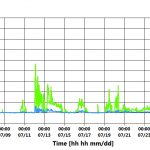
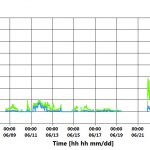
2015
Aerosol Light Scattering
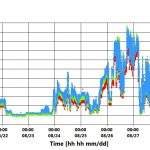
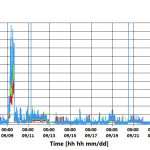
The following graphs depict the time series of the aerosol ability to scatter solar radiation (at three different wavelengths: blue, green and red), which is a climate-relevant aerosol measurement.
2018
2017
2016
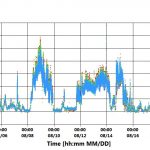
2015
Disclaimer: Data shown here are only minimally processed and quality controlled (for additional information please contact Claudio Mazzoleni: cmazzoleni(at)mtu.edu).
