By Andrea Baccarini, University of Trento, Italy
My name is Andrea, I’m a master’s student in physics from the University of Trento and I spent a couple of months in the Azores for my master’s thesis.
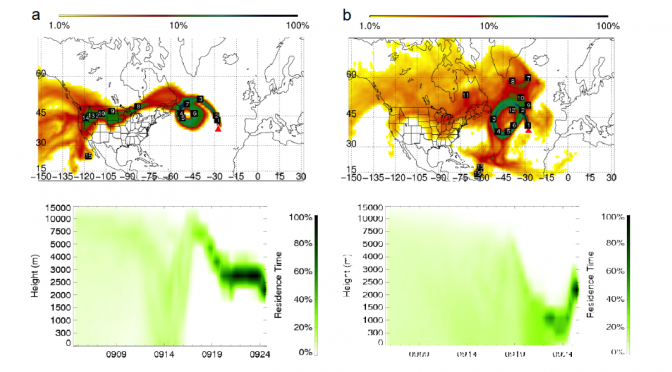
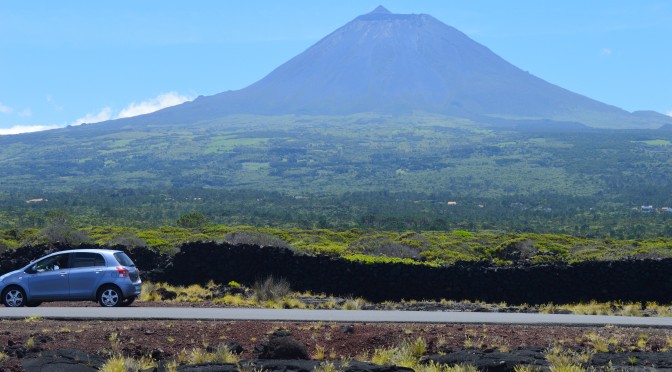
I’m studying the aerosol vertical structure from Pico, a remote island of the Azores, with a stratovolcano. An atmospheric observatory with meteorological observations is located at the top of the volcano. The position of that station is very particular, in fact thanks to its elevation it is situated in the so called “free troposphere”. And, for which reason should this matter? It matters, because it allows us to study air that comes from far away places, typically the North America. Within a certain approximation, we can say that the free tropospheric air is not influenced by the local emissions (I mean the emissions from the island itself) . This is motivated by the fact that the beginning of the free troposphere (called the boundary layer) is characterized by a thermal inversion (Figure 1). Thanks to the thermal inversion, the air masses do not easily exchange components at the boundary layer. The identification of the boundary layer is pretty easy if there are low clouds. In fact in that case the height at which the clouds disappear corresponds to the beginning of the free troposphere.
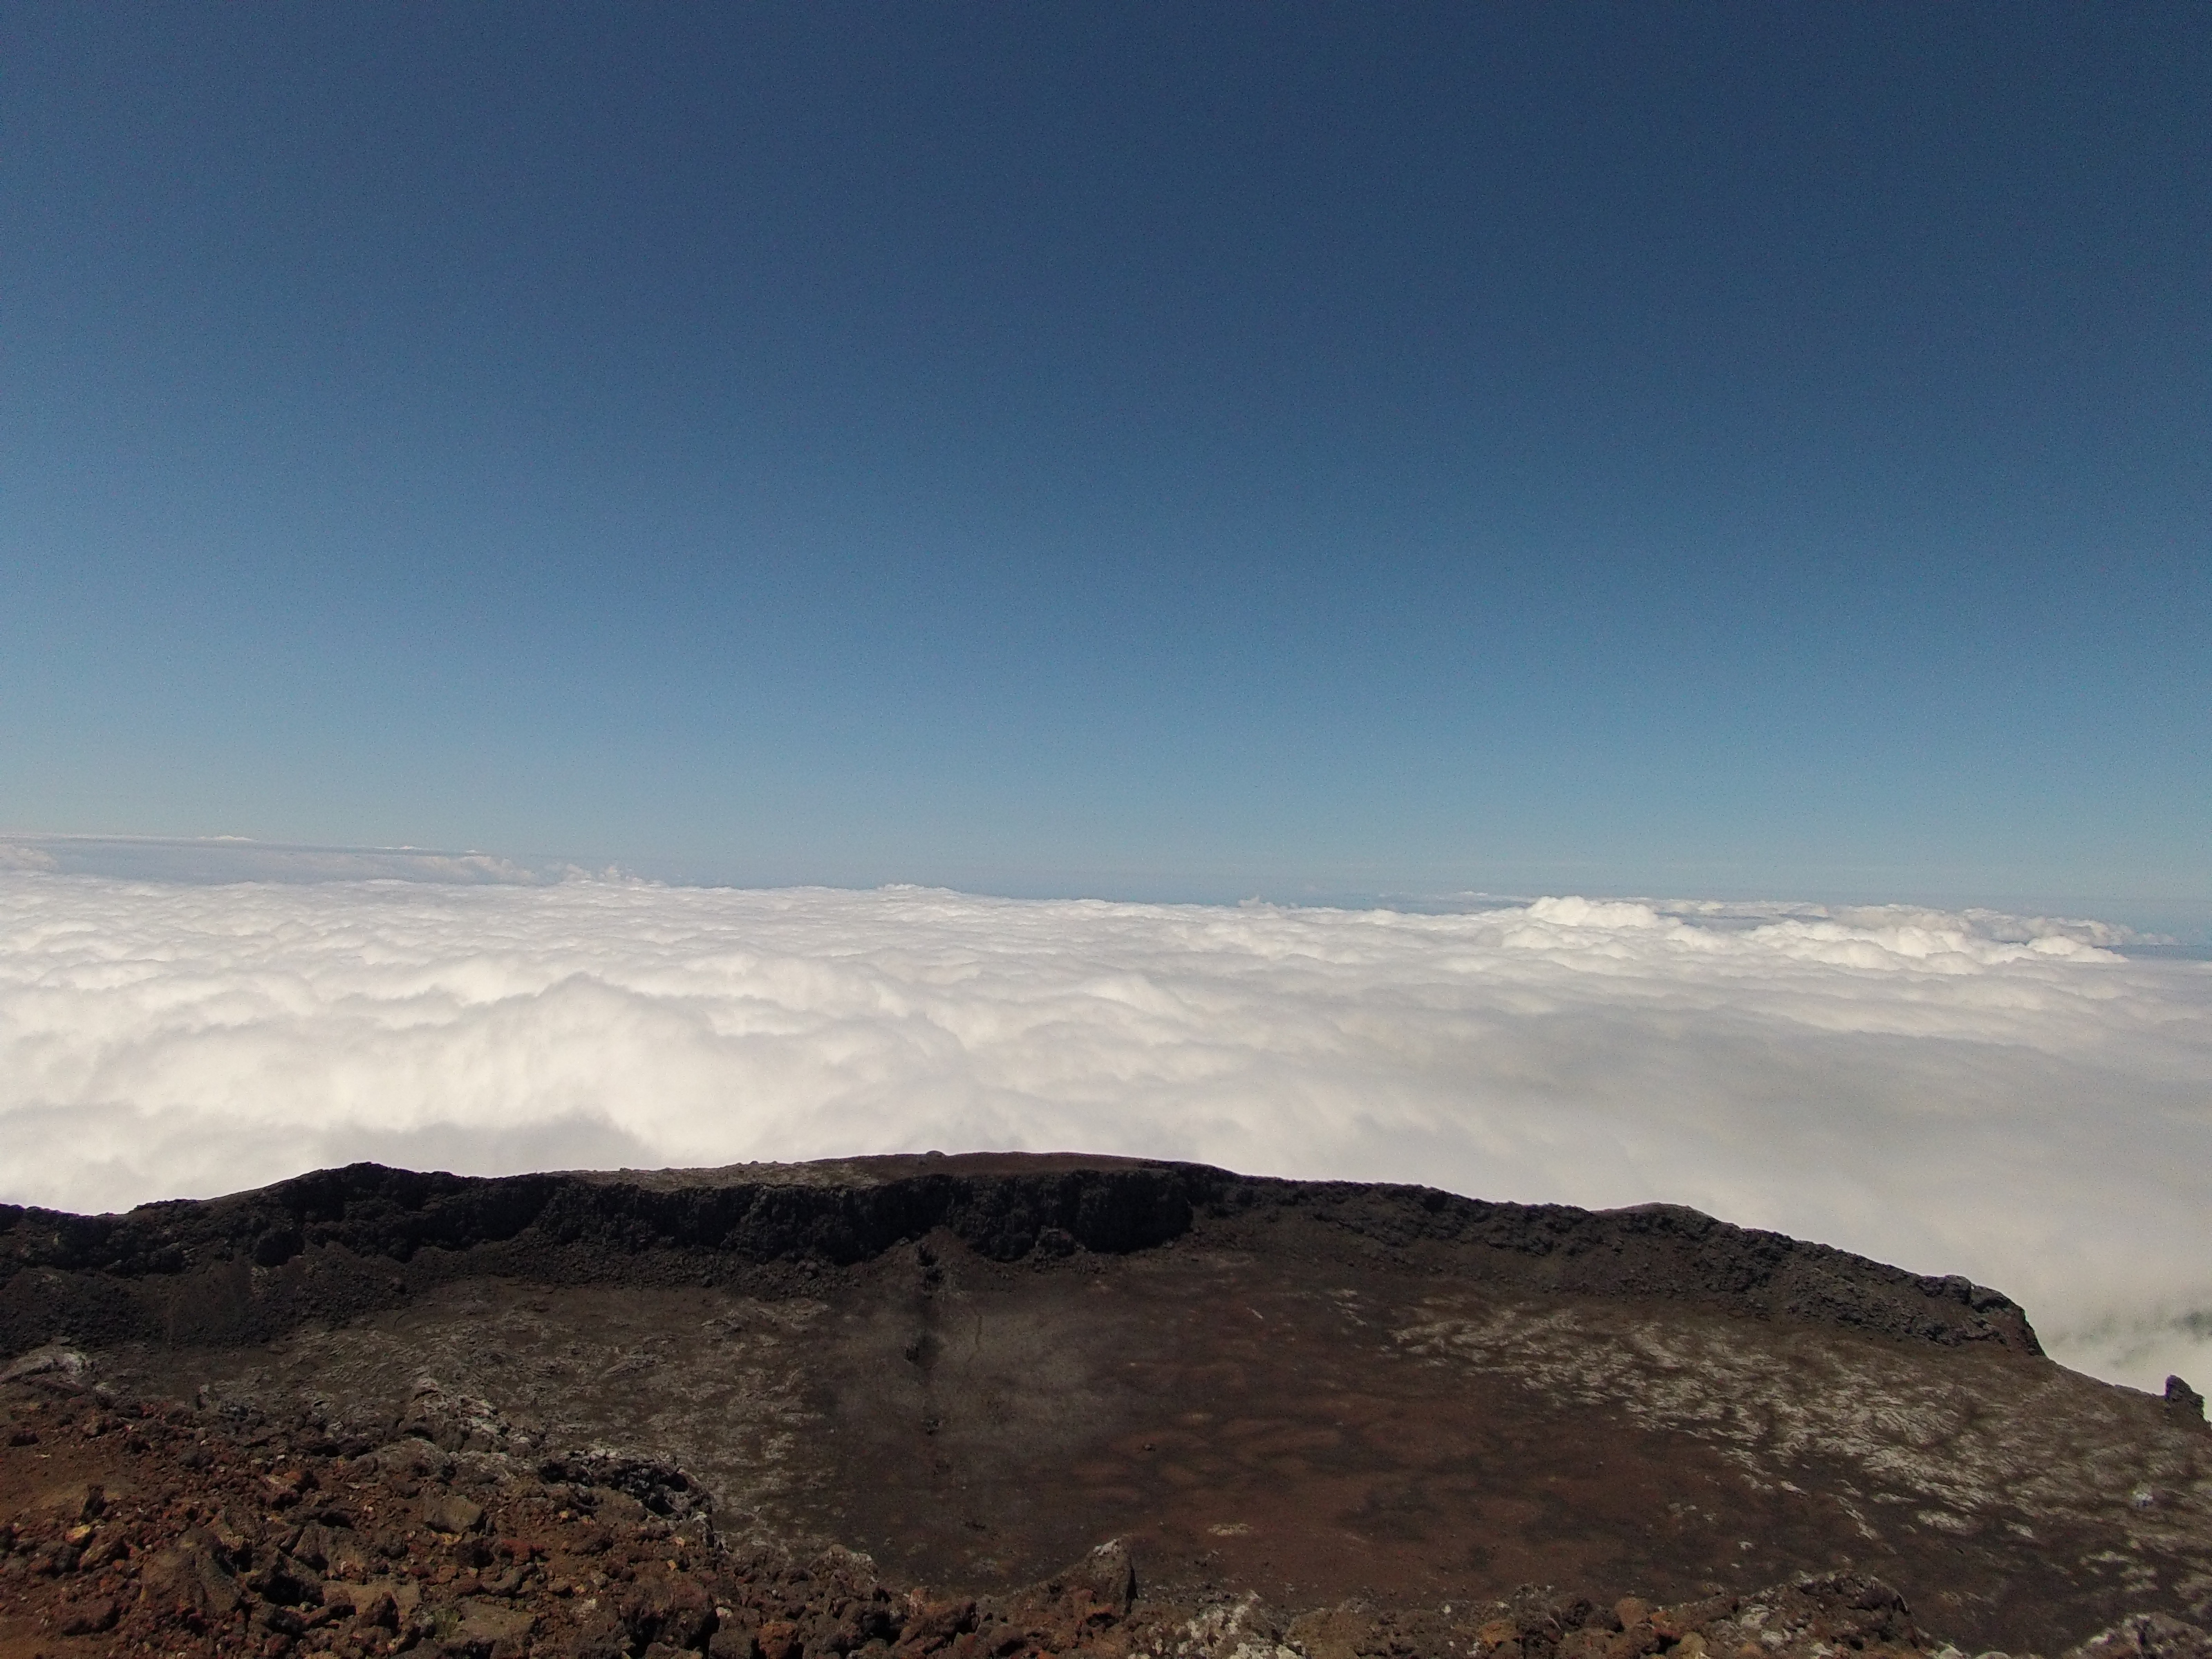
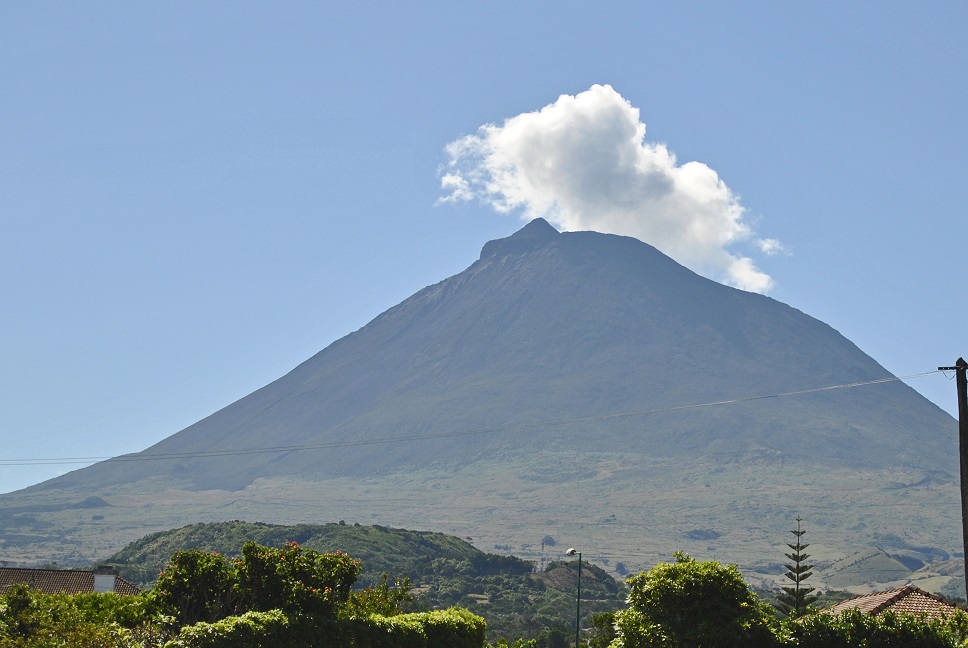
Figure1: The caldera of the Pico volcano with a visible thermal inversion as seen by the confined clouds.
However every time we speak of the atmosphere, we must keep in mind that the situation could be really dynamic, especially if you are on a remote island in the middle of nowhere, exposed to every kind of perturbation. For this reason, it is important to characterize the vertical structure of the atmosphere and to understand within which conditions measurements done at the observatory can be considered to be independent from local emissions.
How do I do this vertical characterization?
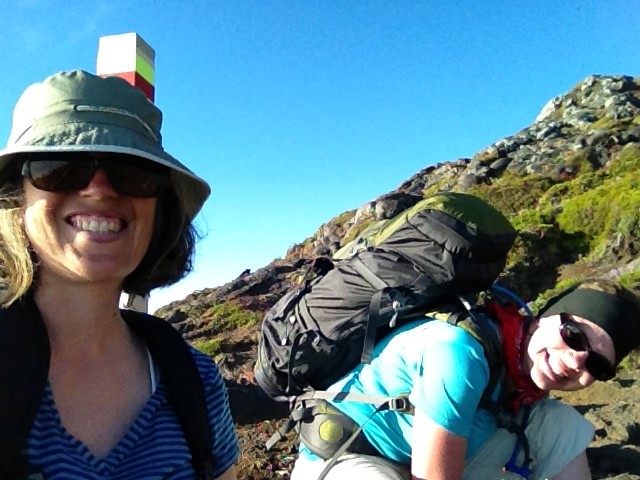
In theory it is pretty simple; I put all my instruments in a backpack and hike (Figure 2), starting from an elevation of about 1200 meters above sea level to the Pico Mountain Observatory (2200 meters above sea level). In my backpack, I have an instrument that collects pressure, temperature and humidity, although it is pretty small I usually put this instrument into a big case to protect it from direct exposure to solar radiation. I also have a nephelometer, this is the biggest instrument, and it measures the light scattered from the particles present in the atmosphere (i.e. Aerosol, dust, etc…). Moreover I carry a particle counter which allows me to measure the concentration of particles with diameters above 0.3 μm and 0.5 μm. This instrument is especially useful because it allows me to distinguish between the dust particles, generally bigger than 0.5 μm, and the combustion aerosols that are generally smaller. Finally I have a sunphotometer, an instrument that measures the intensity of the sunlight that reaches the detector. In this way, it is possible to have an idea of the quantity of haze present into the atmosphere above the observer. In addition to all these instruments, I also use a GPS in order to track my position and my elevation.
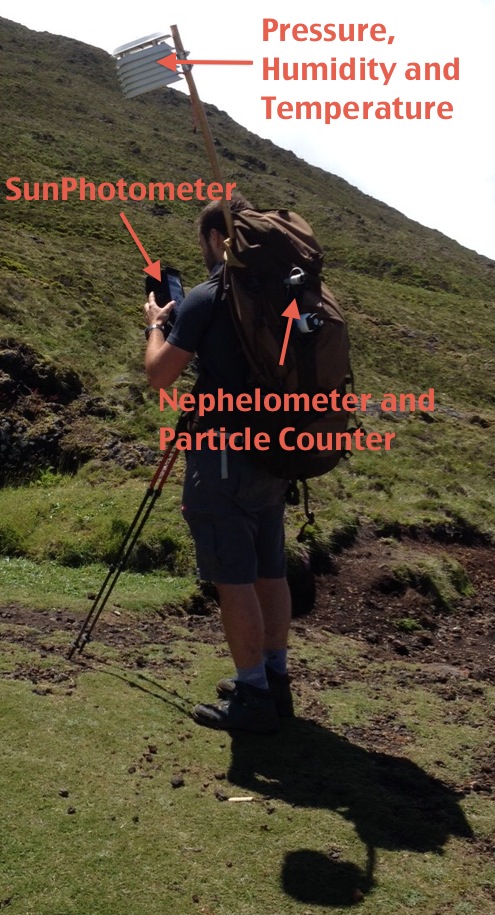
Figure 2: Andrea Baccani with his measurement backpack
A Strange Event
Recently, we noticed a very interesting event that I will describe briefly without much technical detail. On a clear day, with clouds well below the top of the mountain we noticed something unusual. Thin grey layers above the clouds are often visible and are an indication of the presence of some kind of particulate, like aerosol from anthropogenic emission or biomass burning, dust, etc… However on this specific day we noticed a particularity: the layer above the clouds was composed of three well-defined sub layers (Figure 3). This was the first time we observed an event like that and it would be very interesting to understand why that triple stratification happened and if the composition of the layers was different or not.
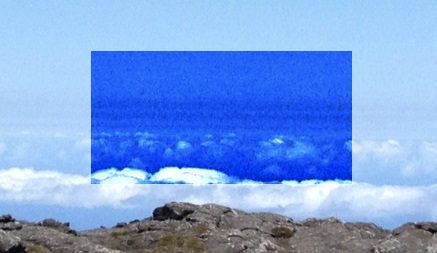
Figure 3: A photo of the aerosol layers above the clouds. High contrast was used to clarify the image (blue box).
The most interesting part is that these three layers were also present in my profiles measurement and this provides us with good informations about the height and the thickness of the layers.
To show this to you, I will use a couple of graphs. The first graph is the particle concentration profile (Figure 4). On the vertical axis there is the elevation while on the horizontal axis there are the particle concentrations. The particles with a size above 0.3 micron are shown in green and those above 0.5 micron are shown in blue. The first thing to notice is that both of the signals have a clear decrease around 1500 meters. This is likely associated with the passage into the free troposphere and is supported by the temperature profile that indicates an inversion at the same height (not reported here). Above the boundary layer there are evident variations in the signal of small particles concentration,while the signal for the bigger particles seems to be pretty stable (around 0.3 particles for cubic centimeter). Because most dust particles are bigger than 0.5 microns we may exclude the presence of dust in the layers. This is pretty important because dust is generally the most abundant type of remote atmospheric aerosols.
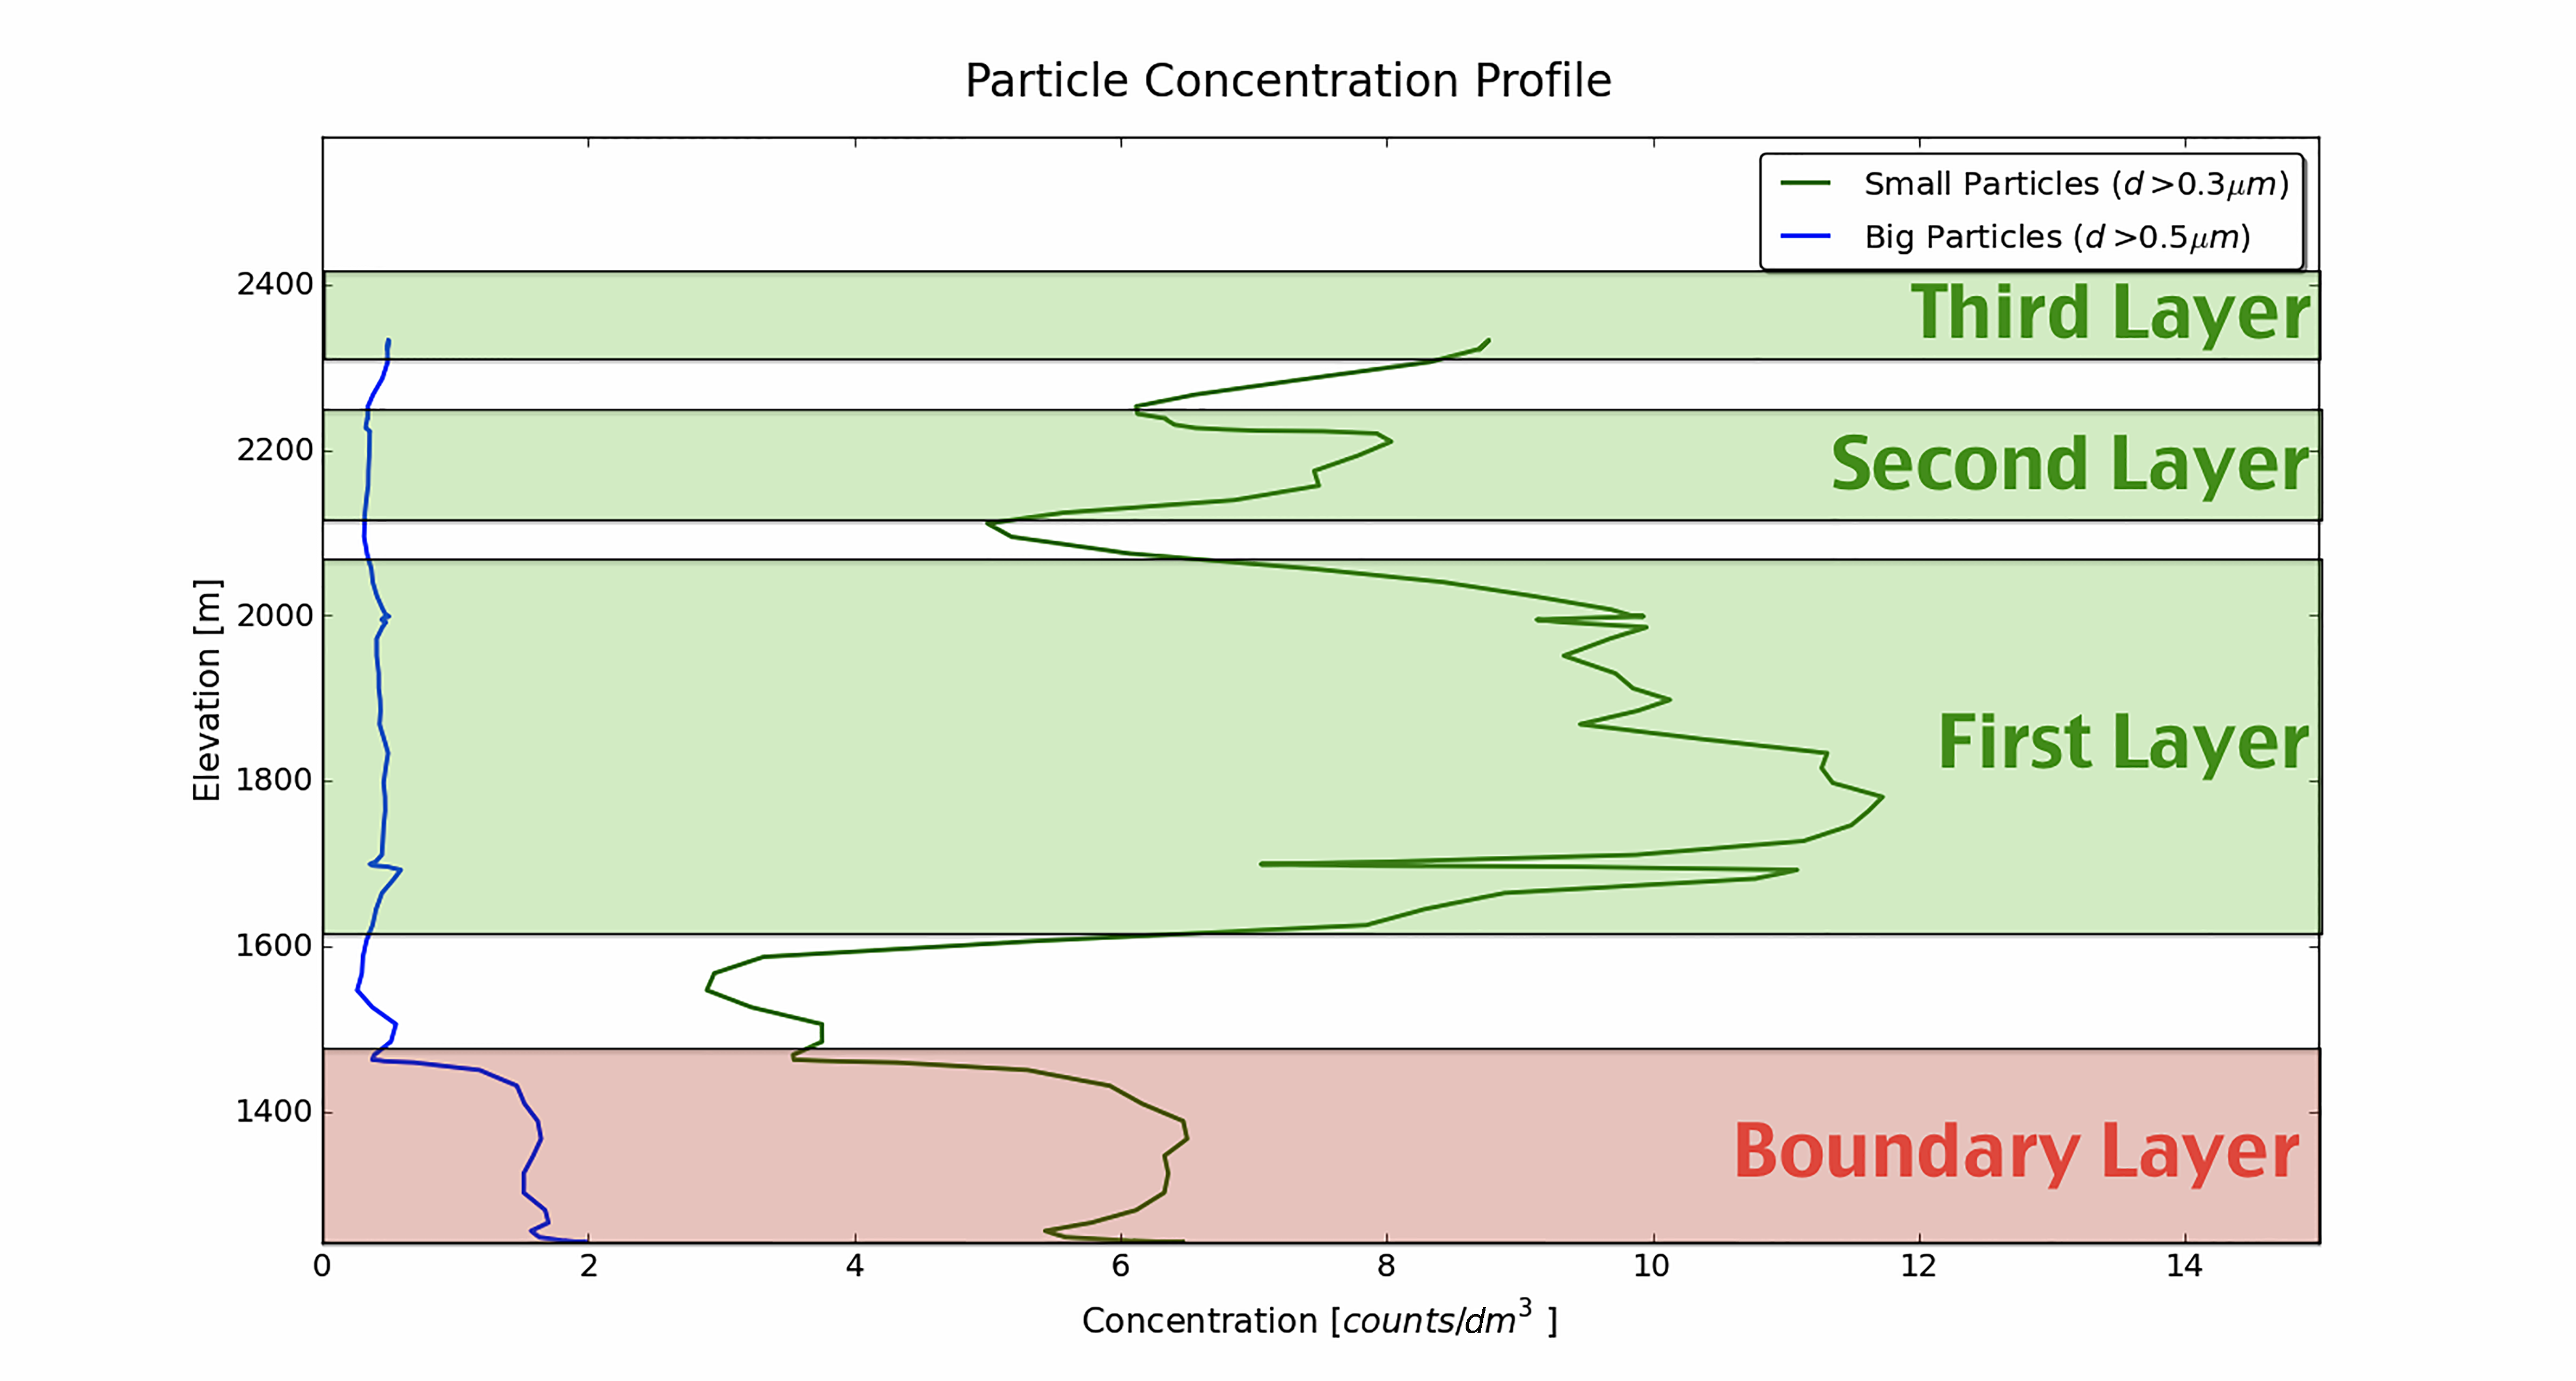
Figure 4: The particle concentration profile observed from the Pico Mountain profile measurements.
Now we can notice that at the moment of the measurements, the first layer was approximately 450 meters thick, starting at a height of 1600 meters and ending at 2050. The second starts around 2100 meters and ends at 2250 meters and for the third later we can observed only the beginning at approximately 2300 meters above the sea level. Clearly the identification of the position of the layers is subjected to some uncertainties that we estimate to be approximately around 50 meters.
In order to confirm these observations we will look at the nephelometer data shown in the graphs below (Figure 5). The elevation is again on the vertical axis and the scattering coefficient is on the horizontal axis. The scattering coefficient, is a measure of the light scattered intensity (it corresponds to the size and the number of particles that scatter the light). In this data the three layers are somewhat less evident because the level of noise is higher, however their position corresponds quite well to those measured with the particle counter.
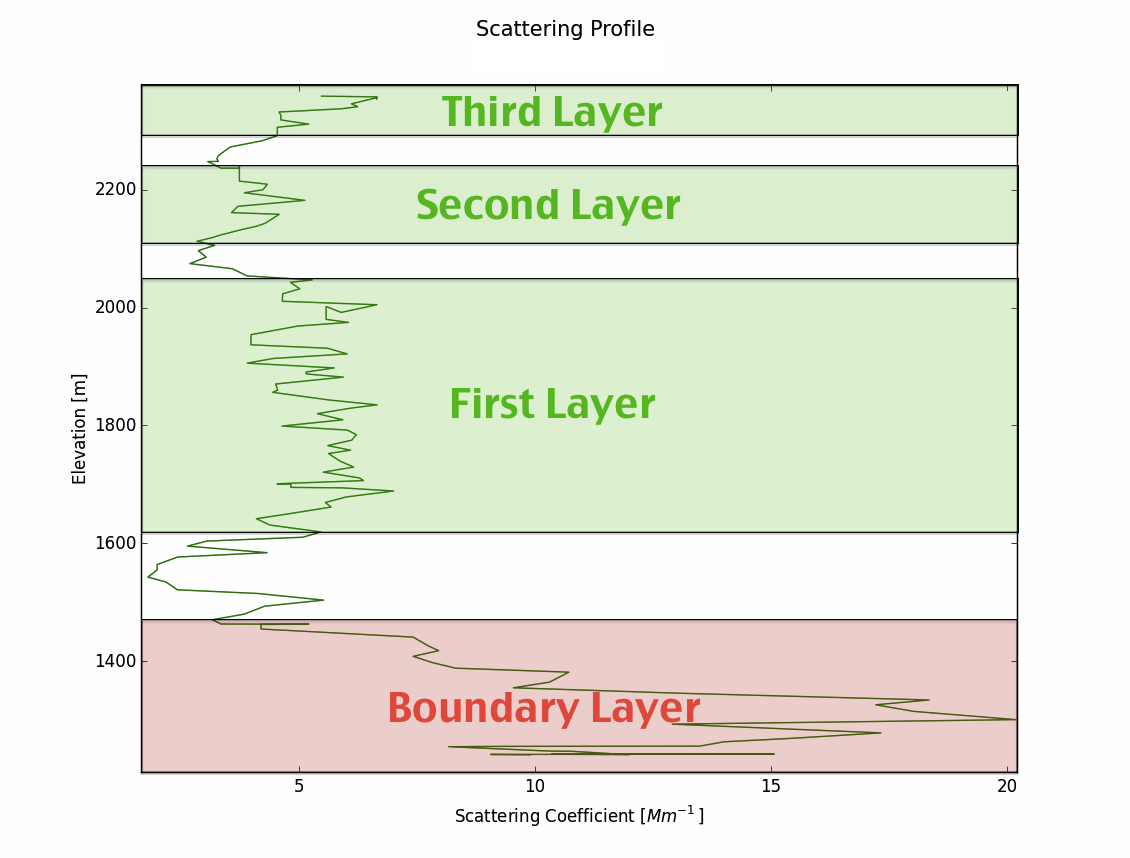
Figure 5: The aerosol scattering profile observed from the Pico Mountain profile measurements.
In summary, we measured the three aerosol layers above clouds with two different instruments. These measurements provide evidence to conclude that what we measured is effectively what we saw looking at the horizon and was not an artifact. However at this moment, this is only a preliminary analysis that requires further technical investigations in order to be confirmed. Moreover, it will be interesting to analyze additional data collected at the station in order to obtain more information about these layers and maybe understand their composition and origin. So, stay tuned because maybe some updates will come!!!
See also – Portuguese News about this study